Literature and movies – whether light or weighty – can provide relevant insights and moments of inspiration for those of us engaged in technical analysis or investing. In Tony Hillerman’s Navajo Tribal police novel Dance Hall of the Dead, Lieutenant Joe Leaphorn remembers what mentor Hosteen Nashibitti told him. “When the dung beetle moves, know that something has moved it.” The lesson reinforces the interdependency of things; each movement has its reason, cause and effect. And so it is with wood flows and stumpage prices. When wood moves, something moved it.
When forecasting stumpage prices, our primary source of “movement” comes from the demand for wood. At Forisk, I build market-specific stumpage forecasts within an explicit forecasting framework:
- Given assumptions about the US economy and housing markets,
- How will demand for wood raw materials drive stumpage prices in each local market,
- Subject to constraints and surpluses in manufacturing capacity and forest supplies.
This article summarizes recent results in two of these areas.
Wood Demand and Sawmill Utilization
Regionally, a critical source of wood demand relies on the productive capacity of sawmills in local markets. In total, localized clusters of softwood sawmills produce the lumber required to satisfy national demand from the housing sector. And these sawmills represent the primary source of sawlog demand and cash flows to timberland owners.
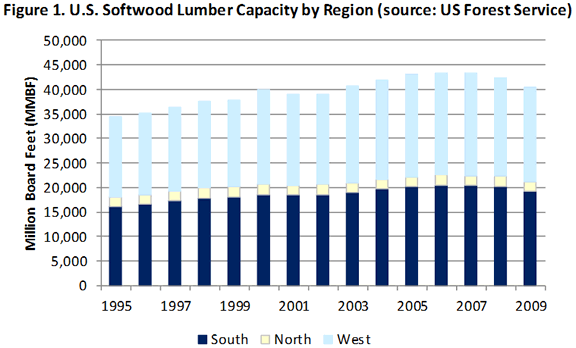
According to the U.S. Forest Service, total U.S. softwood lumber capacity peaked in 2006 (Figure 1). When housing declined, the lumber industry “rationalized” capacity, increasing our stock of idled and closed sawmills. In the U.S. South, the number of mills declined by nearly one-third, from 440 in 1995 to fewer than 300 in 2011. This period also saw the industry move towards larger, more efficient sawmills.

In modeling a given U.S. region, we might ask, “How does current lumber production in the South compare to current lumber capacity in the region?” According to the Southern Forest Products Association, the U.S. South produced 13.61 billion board feet in 2011. According to Forisk analysis of data from the Center for Forest Business, the U.S. South has 16.7 billion board feet of open capacity and another 0.3 BBFT of idled capacity, for a total of 17 billion board feet. This implies a capacity utilization of 80%. This estimate falls in line with tracking of actual wood raw material consumption in the U.S. South. According to the Wood Demand Report, effective capacity utilization in the U.S. South at sawmills as of Q1 2012 was 77%.
Carrying this forward, we see that as housing starts “return to trend”, demand for softwood lumber will outstrip current capacity. This is also true in the U.S. West. Mitigating factors that affect the forecasting of issues such as “capacity constraints” include, for example, the ability of mills to run in excess of 100% by adding extra shifts and by the reopening of closed mills. And localized productive capacity and demand alter the trajectories of potential stumpage prices in different timber markets.
Forest Supplies and Stumpage Prices
When housing slumped in the United States, forest owners and timberland investors took the long view and deferred harvesting sawtimber, the logs needed to produce lumber. Now, as markets improve, we wonder at the new supply and demand equilibrium. In particular, have forest supplies changed in ways that will affect stumpage price recoveries at the local market level in the near-term?
Forisk estimates “removal years”– accessible inventory divided by removals – to identify local markets with potential supply imbalances. This approach builds on research and common measures used for other depleting natural resources. The removal year estimates how many years it would take to deplete standing inventories, given a set level of removals per year. We compare the current removal years to the average removal years specific to the local market or state over the previous 10 years.
For nine of the eleven states studied in the U.S. South, average removal years range from 14 to 24. In other words, at the state level, a typical state with a robust forest industry has 14 to 24 years of standing pine grade inventories during normal times. However, today, all of these states have at least five years more of inventory relative to historic averages. In forecasting wood demand through 2022, Forisk estimates the excess continues to 2013 for all states except Texas.
Excess sawtimber volumes could dampen or delay the “strengthening” of pine sawtimber and chip-n-saw prices in the U.S. South. Specifically, the effect slows pine grade price growth by ~30% per year on average and reduces Base Case pine grade prices by ~$1 per ton over the next two years. This effect varies by state and local market.
Invest with the Long View
In the movie “The Lord of the Rings: The Two Towers”, the great tree-like Ent named Treebeard talks of a great conflict and says, “We must weather such things as we have always done.” To his harried Hobbit friends, the perspective is insufficient, but it does capture an essential truth of taking a long view when making decisions during turbulent times. While prices can move violently, forests and sawmills change and move slowly. The analyses and investments we make today rely a long-term views on how dancing prices and breathing asset values could move given what we know today.
This content may not be used or reproduced in any manner whatsoever, in part or in whole, without written permission of LANDTHINK. Use of this content without permission is a violation of federal copyright law. The articles, posts, comments, opinions and information provided by LANDTHINK are for informational and research purposes only and DOES NOT substitute or coincide with the advice of an attorney, accountant, real estate broker or any other licensed real estate professional. LANDTHINK strongly advises visitors and readers to seek their own professional guidance and advice related to buying, investing in or selling real estate.


Add Comment