There is a tendency to cherry-pick forecasts. A market forecast can be used to serve many masters, and the source and incentives of the forecast provider may matter. In our work, “What will housing do next year?” may be the wrong question. Rather, we ask, “How will this local timber market perform relative to others if housing does this or housing does that?” In this way, we apply forward-looking scenarios to our understanding of the “facts on the ground.” Our models test how local timber markets and wood baskets perform, relative to each other, given different economic scenarios. This requires a baseline perspective on housing markets.
2017 Housing Forecast Update
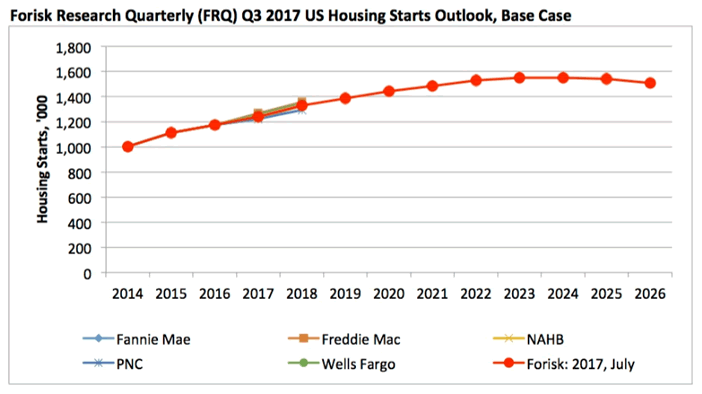
Forisk’s Housing Starts Outlook combines independent forecasts from professionals in the housing industry. Currently, these include Fannie Mae, Freddie Mac, the National Association of Home Builders (NAHB), PNC, and Wells Fargo. Forisk applies long-term assumptions from the U.S. Energy Information Administration (EIA) and Harvard’s Joint Center for Housing Studies to establish the peak and trend over the next ten years (Figure).

Overall, Forisk projects 2017 housing starts of 1.24 million, up 5.7% from 2016 actuals. This remains within 1% of our Q1 estimate. Forisk’s 2017 Base Case peaks at 1.55 million housing starts in 2023 and 2024 before returning to a long-term trend approaching 1.50 million.
2017 Forisk Forecast Scorecard
Each quarter, we look back and evaluate the performance of previous forecasts and earlier models. The process of reviewing assumptions and updating models encourages, if nothing else, humility. Analytically, the process reminds us how some drivers are more important than others. Price to demand and supply relationships change over time. For this reason, we spend most of our time confirming knowable facts on the ground related to mill investments, forest supplies, and technological advances.
How have Forisk’s forecasts for 2017 tracked relative to actuals through the first half of the year? Above we reconciled Forisk’s Housing Outlook. Here we summarize the year-to-date results across three other measures:
1. U.S. Softwood Lumber Consumption
Forecast: In Q1 2017, Forisk projected domestic U.S. softwood lumber consumption of 48.7 billion board feet, or 3.3% growth over 2016 actuals.
H1 2017: Actual U.S. softwood lumber consumption through April was 16.0 billion board feet, which is 48.0 billion board feet on an annualized basis, or 1.4% below the Forisk Forecast.
2. U.S. Structural Panel Consumption
Forecast: Forisk projected 30.9 billion square feet of structural panel (OSB and plywood) consumption in the U.S. for 2017, or 6.3% above 2016.
H1 2017: According to the APA, actual structural panel consumption through Q2 2017 was 15.1 billion square feet, which is 30.2 billion on an annualized basis. This tracks 3.3% below the Forisk Forecast as of Q1 and 1% below our most recent update of 30.5 billion square feet.
3. Pacific Northwest Domestic Sawlog Prices
Forecast: In Q1, Forisk projected domestic #2 delivered Douglas-fir sawlog price growth of 1.2% for 2017 for Coastal Oregon and Washington.
H1 2017: Half-way through 2017, the four-quarter rolling average price for #2 delivered Douglas-fir sawlogs increased 5.1%, or about $23 per MBF higher than Forisk’s Q1 estimate.
This content may not be used or reproduced in any manner whatsoever, in part or in whole, without written permission of LANDTHINK. Use of this content without permission is a violation of federal copyright law. The articles, posts, comments, opinions and information provided by LANDTHINK are for informational and research purposes only and DOES NOT substitute or coincide with the advice of an attorney, accountant, real estate broker or any other licensed real estate professional. LANDTHINK strongly advises visitors and readers to seek their own professional guidance and advice related to buying, investing in or selling real estate.


Add Comment